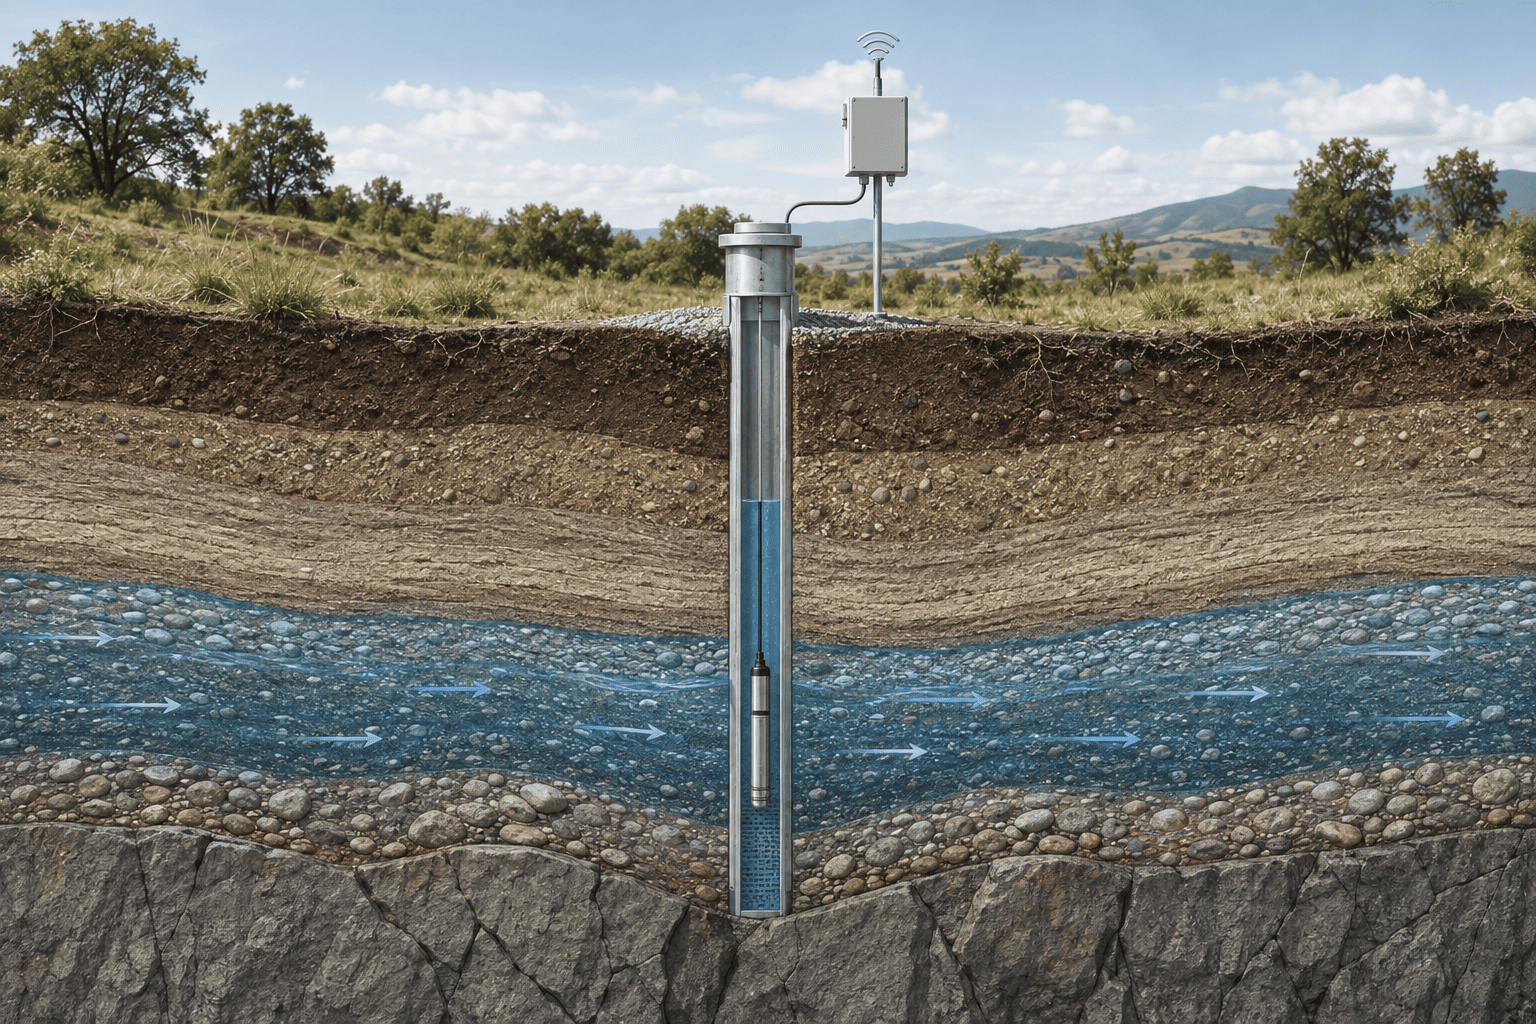
Groundwater Pipeline
No job run yet
Bruchmühle 34 - daily working sheet
1
Upload source files
Groundwater logger export (30-min)
Any of the known raw export formats - format is auto-detected.
Weather (air temp / pressure, 15-min)
Rainfall (daily)
Run pipeline
2
Pipeline status
Date range
Last 90 days
Last 12 months
All data
Custom:
–
Apply
3
Groundwater level & rainfall
⬇ GWL chart PNG
⬇ Rainfall chart PNG
GWL (m above sea level)
Rainfall (mm/day)
4
Final daily dataset
⬇ Download Excel
Date
GW Temp (°C)
GW Pressure (mBar)
Air Temp (°C)
Air Pressure (mBar)
Rainfall (mm)
Press. Diff (mBar)
Water lvl above sensor (cm)
GWL (m)
Depth (m.b.g.l)